
Bad Science, Good Politics
Richard Lynn and the rehabilitation of blood hierarchy for the internet age

There is an effort underway to discredit scientific institutions and universities on the charge that science has become “too political.” The argument goes something like this: science should be value-neutral, concerned only with objective truth. When scientists discredit research because they fear the political implications – say, data showing that intelligence differs between races and nations – they have abandoned the scientific method in favor of ideology.
It is a seductive argument, and a clever one. It allows its proponents to position themselves as defenders of Reason against the corrupting influence of politics. But the argument serves a purpose beyond epistemology. It provides cover for a specific set of claims that have no legitimate scientific basis yet are presented as forbidden truths that the “woke” scientific establishment refuses to acknowledge. If you can convince people that “scientific racism” is an oxymoron – that science deals only in truth, and truth cannot be racist – then you can launder a centuries-old ideology of racial hierarchy through the prestige of science itself.
In the 4th century B.C.E., Aristotle formalized the concept of scala naturae – the “natural ladder” according to which all creation was connected in a hierarchy from the lowest to the highest forms of being. In the 15th century Crown of Castile, Crown of Aragon, and Kingdom of Portugal, limpeza de sangue (“cleanliness of blood”) statutes were used to discriminate against “New Christians” – Jewish converts and forcibly converted Muslims – on the belief that “the body’s fluids, and especially blood, transmitted a certain number of moral qualities from parents to children”. During the Age of Enlightenment, pre-Adamism – the belief that there were inferior humans who existed prior to creation of Adam and Eve – flourished. In 1895, German physician Alfred Ploetz introduced the term rassenhygiene (“racial hygiene”) in Grundlinien einer Rassenhygiene (“Racial Hygiene Basics”) – originally more concerned with the declining birthrate of the German state and the increasing number of mentally-ill and disabled people in state-run institutions than the entnordung (“degeneration of the Nordic race”) that would come to dominate the philosophy. At the close of the 20th century – a century defined by the horror wrought by these ideas – the philosophy had far from died. Only it was now called human biodiversity. A modern name to serve an old god.

Columnist and blogger Steve Sailer founded the Human Biodiversity Institute in 1999. Popular members included J. Philippe Rushton, Charles Murray, and Steven Pinker, an early member who published work by Sailer and quoted him on his website. Its members argue that biological differences between races – such as differences in intelligence, personality, and propensity toward criminality – can be scientifically measured and used to explain disparities in society. The think tank is no longer active – its electronic mailing list went defunct – but it doesn’t need to be1. The philosophy it was founded to espouse is not only alive but woven into the fabric of our zeitgeist.
But ideology alone cannot sustain itself indefinitely. It requires the appearance of evidence. Enter Richard Lynn’s “National IQ” dataset, which purports to rank countries by average intelligence. This dataset, first published in 2002 and updated several times (most recently in 2023), is now maintained by David Becker at the Ulster Institute for Social Research and contains 660 studies spanning 130 countries. It is cited by every major proponent of human biodiversity. The dataset is also garbage. Not flawed, but still useful garbage. Not rough, but directionally correct garbage. It is the kind of garbage that, upon close inspection, can only make sense in the shadow of the ideological project standing behind it.
Science, properly understood, does not deal in facts. I still remember my eighth-grade science teacher explaining the philosophy of science. “We cannot say for certain,” she told us, “that a Tyrannosaurus rex with a time machine was not in this room just now, and we are only forgetting because our memories were wiped. We can only say it is highly improbable.” What science deals in is what is not a fact – what has been tested and falsified, what hypotheses have failed to survive contact with evidence. Science is a machine for eliminating error, not a scripture for proclaiming truth. When data is fabricated, when methodologies are hidden, when conclusions are predetermined by ideology, the machinery breaks. It doesn’t matter whether the person breaking it is on your team or the other team. Broken is broken.
My objection to Richard Lynn is that his methods are indefensible, and that his stated purpose was not inquiry but advocacy. That is not a political opinion. It is a methodological one.
Lynn never published any selection criteria or methodology for how he chose which studies to include in his dataset. Meta-analyses are supposed to specify inclusion and exclusion criteria before data collection begins, to prevent the analyst from cherry-picking studies that support their preferred conclusions. In 2010, psychologist Jelte Wicherts and colleagues at the University of Amsterdam conducted their own systematic literature review of IQ studies in sub-Saharan Africa. They discovered that the only consistent feature in Lynn’s selection process was the IQ score itself: the lower the reported IQ, the more likely Lynn was to include the study.
Wicherts found that Lynn excluded every single available study that reported an average IQ of above 85 for African samples. When Lynn rejected a study showing an IQ of 91 for a sample of African children, he claimed it was because the study “lacked information regarding the age of the children”. Yet he included five other studies that also lacked age information – all of which reported IQs between 63 and 72. As Wicherts and colleagues concluded: “It is hard to avoid the impression that [Lynn’s] assessment of representativeness was a function of the average IQ in the sample.” I would encourage readers to peruse the dataset themselves. You can download it here. The spreadsheet itself reveals problems that would disqualify it from consideration in any serious peer-reviewed context.
First, there is the floor effect. The dataset imposes a minimum IQ of 60 – any study producing a lower score gets raised to this threshold. Forty-three studies hit this floor, meaning their actual calculated values were lower still. For Nepal, all eight studies in the dataset registered at exactly 60 after correction. The uncorrected values ranged from 40.7 to 48.3. This is data censorship that disguises the implausibility of the underlying methodology.
Then you have the within-country variance. If national IQ measured something stable and heritable, we would expect studies within the same country to converge on similar values. They do not. Thailand’s estimates range from 60 to 110. The United States, with 57 studies, ranges from 70.5 to 109.9. When the same country can produce estimates varying by three standard deviations depending on which study you select, the concept of a single national IQ becomes incoherent. A mean is only useful when the underlying data cluster around it. When variance is this high, the mean describes nothing – it is a number without a referent, an average of incommensurable measurements.
Eleven studies in the dataset measure people who were tested in a different country than the one to which their scores are attributed. The dataset’s own coding system flags these as “foreign origin” samples, yet they are used as national estimates. Forty-five countries in the dataset have no nationally representative or normative samples whatsoever – only “random”, “control”, or “selective” samples from specific subpopulations. This list includes Nepal (8 studies, all at floor), Gambia (6 studies, all at floor), Somalia, Mali, Sierra Leone, the Democratic Republic of Congo, and South Sudan. The lowest IQ estimates in the dataset come disproportionately from countries where no representative sampling was ever conducted.
Eighty-nine studies contain keywords in their citations indicating they were nutrition interventions, deworming programs, or similar treatment studies. These studies measured children who were specifically selected because they suffered from malnutrition, parasitic infection, or other conditions known to affect cognitive development. The point of such research is to document the cognitive effects of deprivation and measure whether intervention helps. Lynn repurposes these measurements of sick or malnourished children as evidence of national cognitive capacity.
Seventy-five studies – more than 11 percent of the dataset – were published in Mankind Quarterly. The journal was founded in 1960 by segregationists and eugenicists, funded by the Pioneer Fund, and designed explicitly as a response to efforts to end segregation in the American South. Lynn served on its editorial board for decades. Perhaps we should be skeptical of its neutrality. The dataset and the journal are the same project, maintained by the same people, in service of the same ideology.
Its numbers are in active political circulation right now, attached to real communities, used to justify real policies.
In September 2024, during a presidential debate watched by 67 million Americans, the President amplified a claim that Haitian immigrants in Springfield, Ohio were “eating the dogs…eating the cats…eating the pets of the people that live there.” The claim, which originated from an unverified Facebook post and was promoted by the Vice President, was immediately debunked by city officials, the police, and the Republican Governor of Ohio. It did not matter. The story spread. Bomb threats forced schools and government buildings to evacuate. A Haitian community group filed criminal charges against the President and Vice President. PolitiFact named it the “Lie of the Year”. And in the comment sections and reply threads that trailed the coverage, users cited Lynn’s national IQ estimate for Haiti – supposedly 67 – as evidence that Haitian immigrants were, by nature, incapable of integration.
Lynn’s estimate for Haiti is derived from two studies. The first, conducted in 1975 by Haitian researchers Hubert de Ronceray and Serge Petit-Frère, was not a study of Haitian intelligence. It was a bilingual education experiment testing whether rural children taught in Creole would learn better than those taught exclusively in French. The researchers selected 133 six-year-olds from farming families in the Léogane plain – children who had never attended school – and administered the Raven Progressive Matrices at the start of the program to establish a baseline. Lynn’s public National IQ spreadsheet records the result: IQ 96.85. Essentially average. Rural Haitian children from illiterate farming families, tested before receiving any formal education, scored at the same level as British children of the same age.
The second study, conducted in 1985, was an evaluation of a USAID Title II school feeding program. Title II programs provide food aid to malnourished populations. The study measured 54 children who were receiving nutritional assistance precisely because they were food insecure. The cognitive effects of childhood malnutrition are well-documented and can be severe. Lynn’s spreadsheet records this result: IQ 60. The number cited to explain why Haitians eat pets and cannot integrate into American society is the average of a bilingual study showing normal cognitive development and a malnutrition intervention study measuring hungry children. The first study, on its own, would suggest Haitian children are cognitively indistinguishable from their British peers. But it is not reported on its own. It is diluted by a study designed to document the effects of food insecurity, then presented as a fact about Haitian biology. The number did not cause the lie that immigrants in Ohio were eating pets, but it gave it a patina of scientific authority.
In late 2025, the President turned his attention to the Somali community in Minnesota – the largest in the United States. He announced the revocation of Temporary Protected Status for Somalis and dispatched ICE agents to Minneapolis in what the administration called “Operation Metro Surge”. There is real fraud in Minnesota. The Feeding our Future scheme alone may have stolen $300 million in federal funds. Dozens have been convicted. On December 26, a YouTuber named Nick Shirley posted a 43-minute video claiming that Somali-run daycare centers in Minneapolis were committing widespread fraud. The video was amplified by the Vice President, Elon Musk, and FBI Director Kash Patel. Within days, the federal government froze all childcare payments to Minnesota. Governor Tim Walz suspended his reelection campaign. Somali-owned businesses were vandalized. On January 7, a U.S. citizen named Renee Nicole Good was shot and killed by an ICE agent in south Minneapolis. Whether there is additional fraud worth investigating is a question of evidence – of audits, records, site visits. It is a question of law and policy. But once again, in the discourse that surrounded these events, a different kind of answer appeared. Matt Walsh posted it to his 3.7 million followers. Gateway Pundit published it in a headline: “Somalia’s Average IQ Score Meets the U.S. Standard for Intellectual Disability”. The number was 68. This is what the number does. It forecloses investigation. There is no need to ask how such fraud was possible, or what systemic failures allowed it, or how to prevent it in the future. The number presupposes the answer: it is simply what Somalis do.

Lynn’s estimate of Somalia’s national IQ – actually 67.7 – is derived from a single 2015 study of 2440 Somali children aged 8-18 years old living in the Dadaab refugee camps in Kenya. These camps were established in 1991 following the Somali Civil War, but newer refugees have arrived fleeing drought and famine. It is the second largest refugee camp in the world.
The study was published as a six-page article in the aforementioned Mankind Quarterly. Its authors include Richard Lynn.
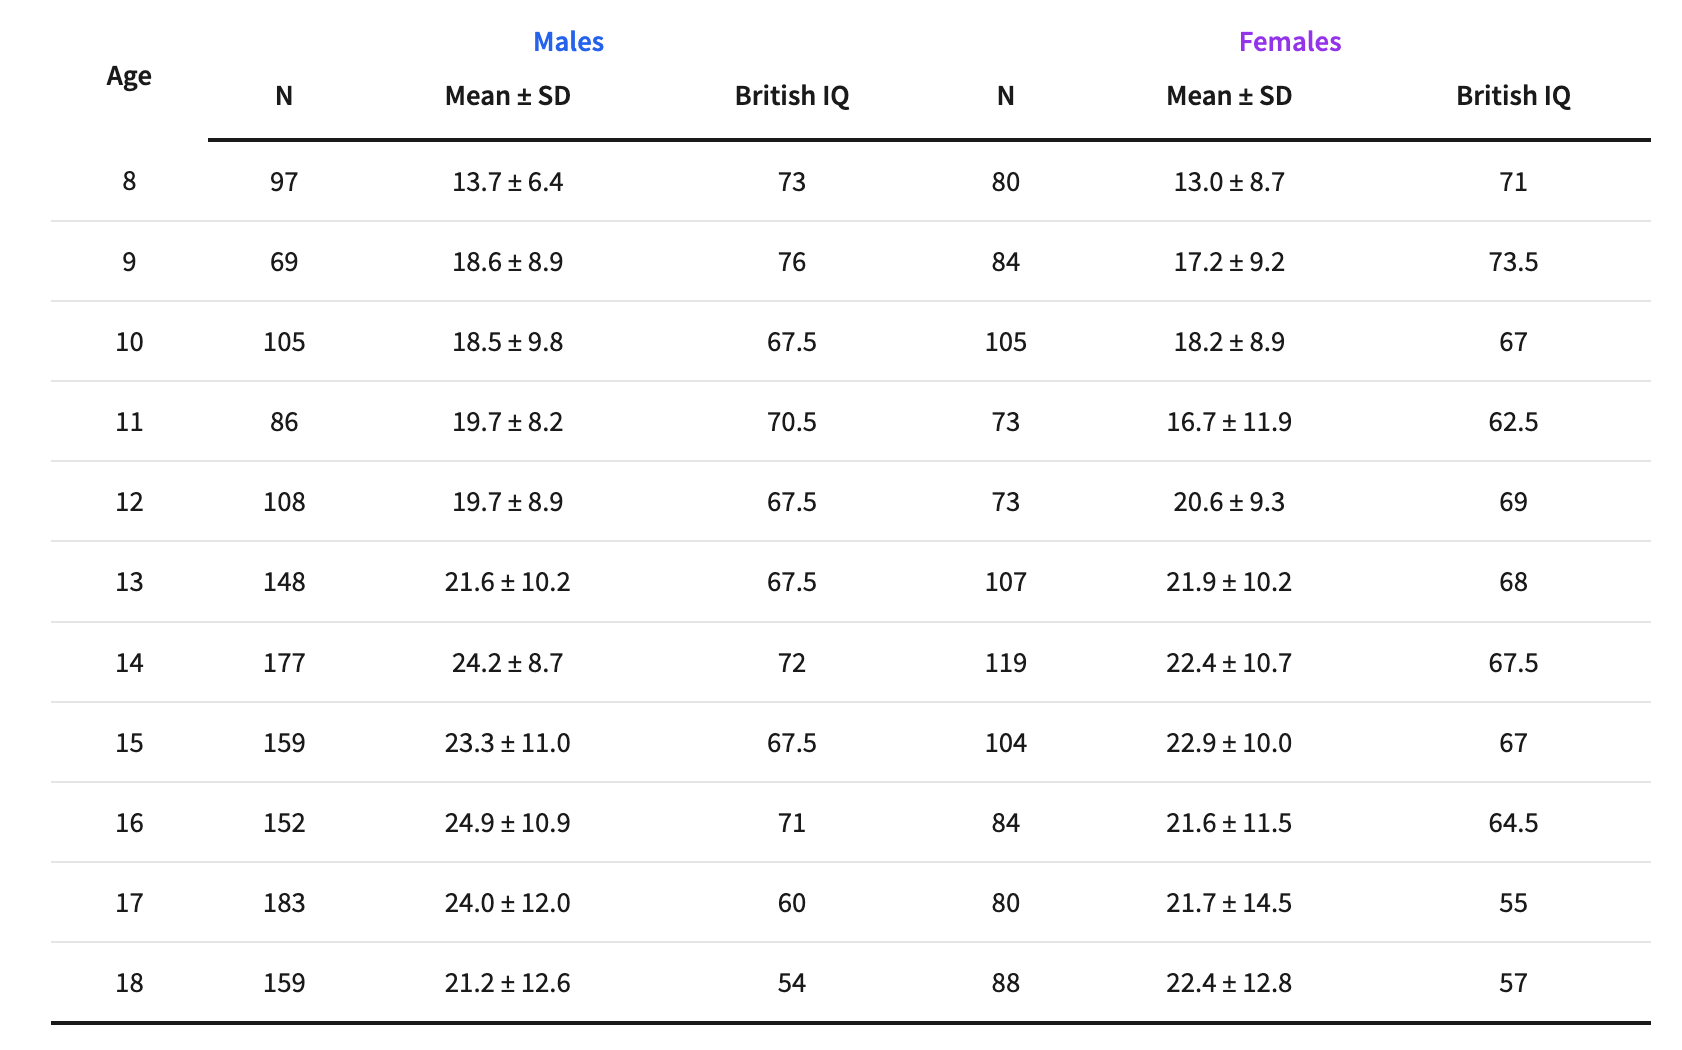
To understand what follows, you need to know how Lynn’s dataset works. Raw scores on cognitive tests are meaningless on their own – they must be converted to a standardized scale. Lynn’s dataset converts all scores to “British IQ”: a scale where the British average is set to 100 with a standard deviation of 15. Every national estimate in the dataset is expressed relative to this British baseline. This has become known as the Greenwich IQ metric. The question the dataset claims to answer is: how does this population compare to the British?
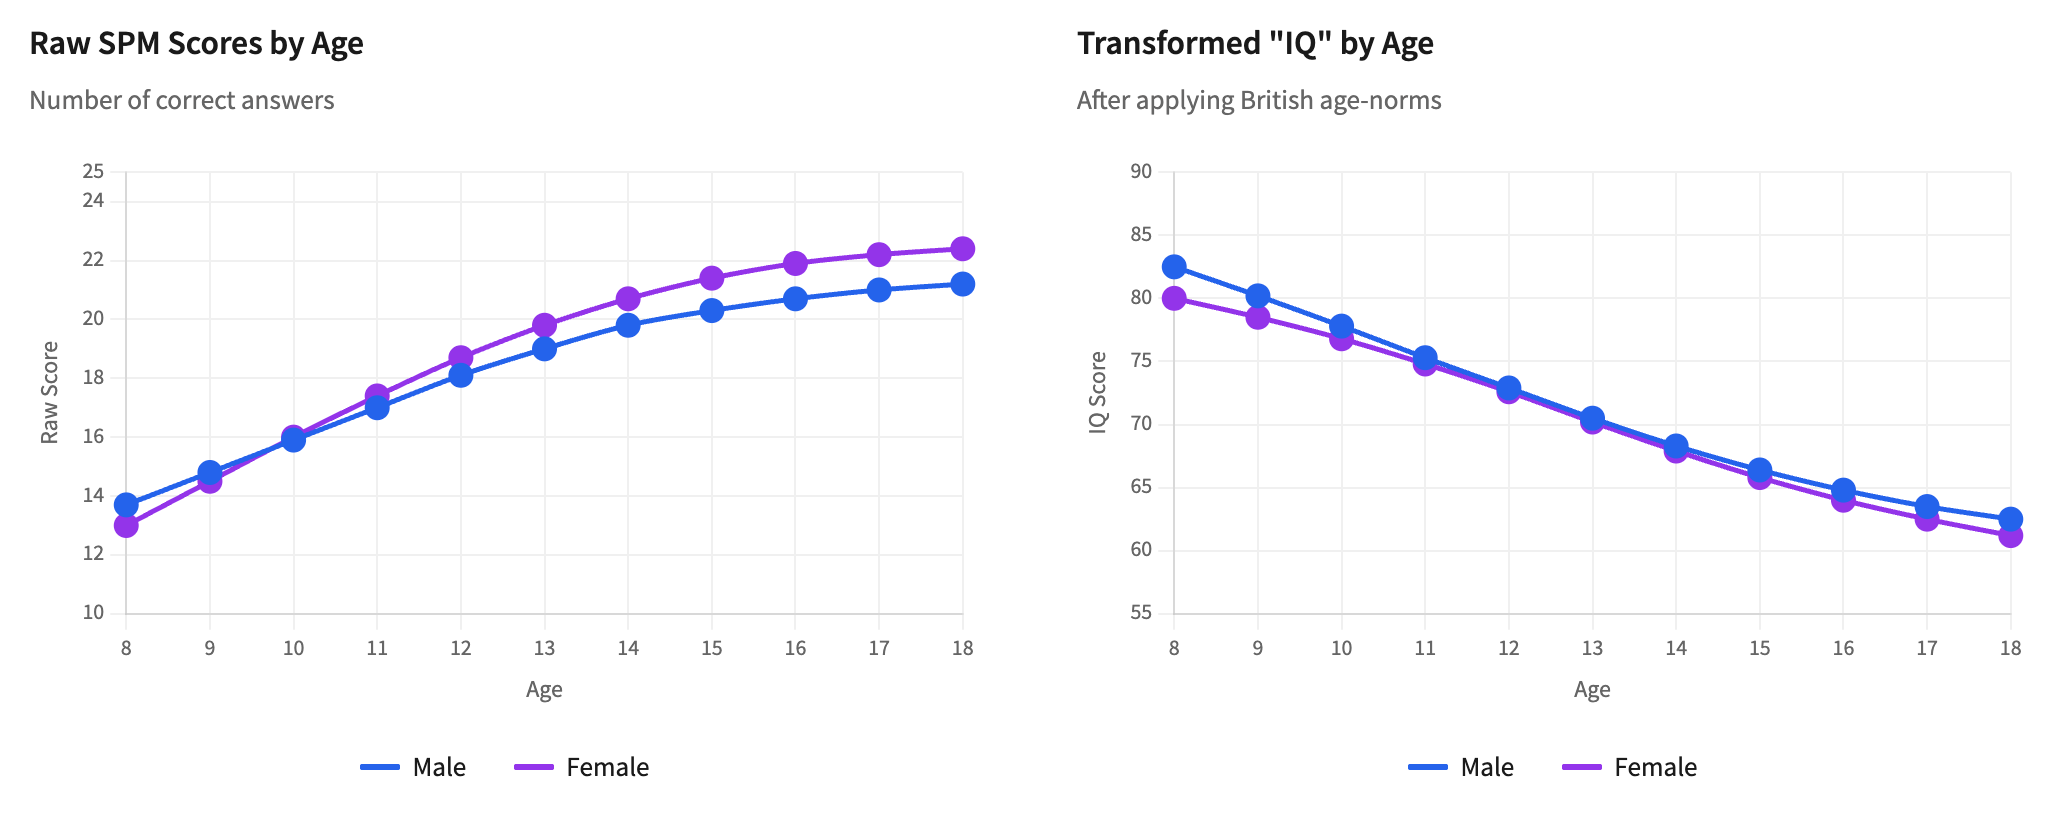
Now look at the transformed “British IQ” scores as the age of the participants increases. The untransformed scores increase from 13.7 to 21.2 for males, and 13.0 to 22.4 for females – older children answer more questions correctly, as expected. But the transformed IQ scores drop by almost 20 points from age 8 to 18.
The point of IQ score norming is that scores should be stable across age groups – a properly normed test adjusts for age so that a 10-year-old and an 18-year-old of equal relative cognitive ability receive the same IQ score. But British norms expect raw scores to increase at a rate that reflects British schooling – years of exposure to abstract pattern-recognition that formal education provides and refugee camps do not. When you apply these norms to a population with interrupted or absent schooling, younger children appear “closer to normal” while older children fall further behind the expected British trajectory. The test is not measuring genetic cognitive capacity. It is measuring cumulative educational deprivation.
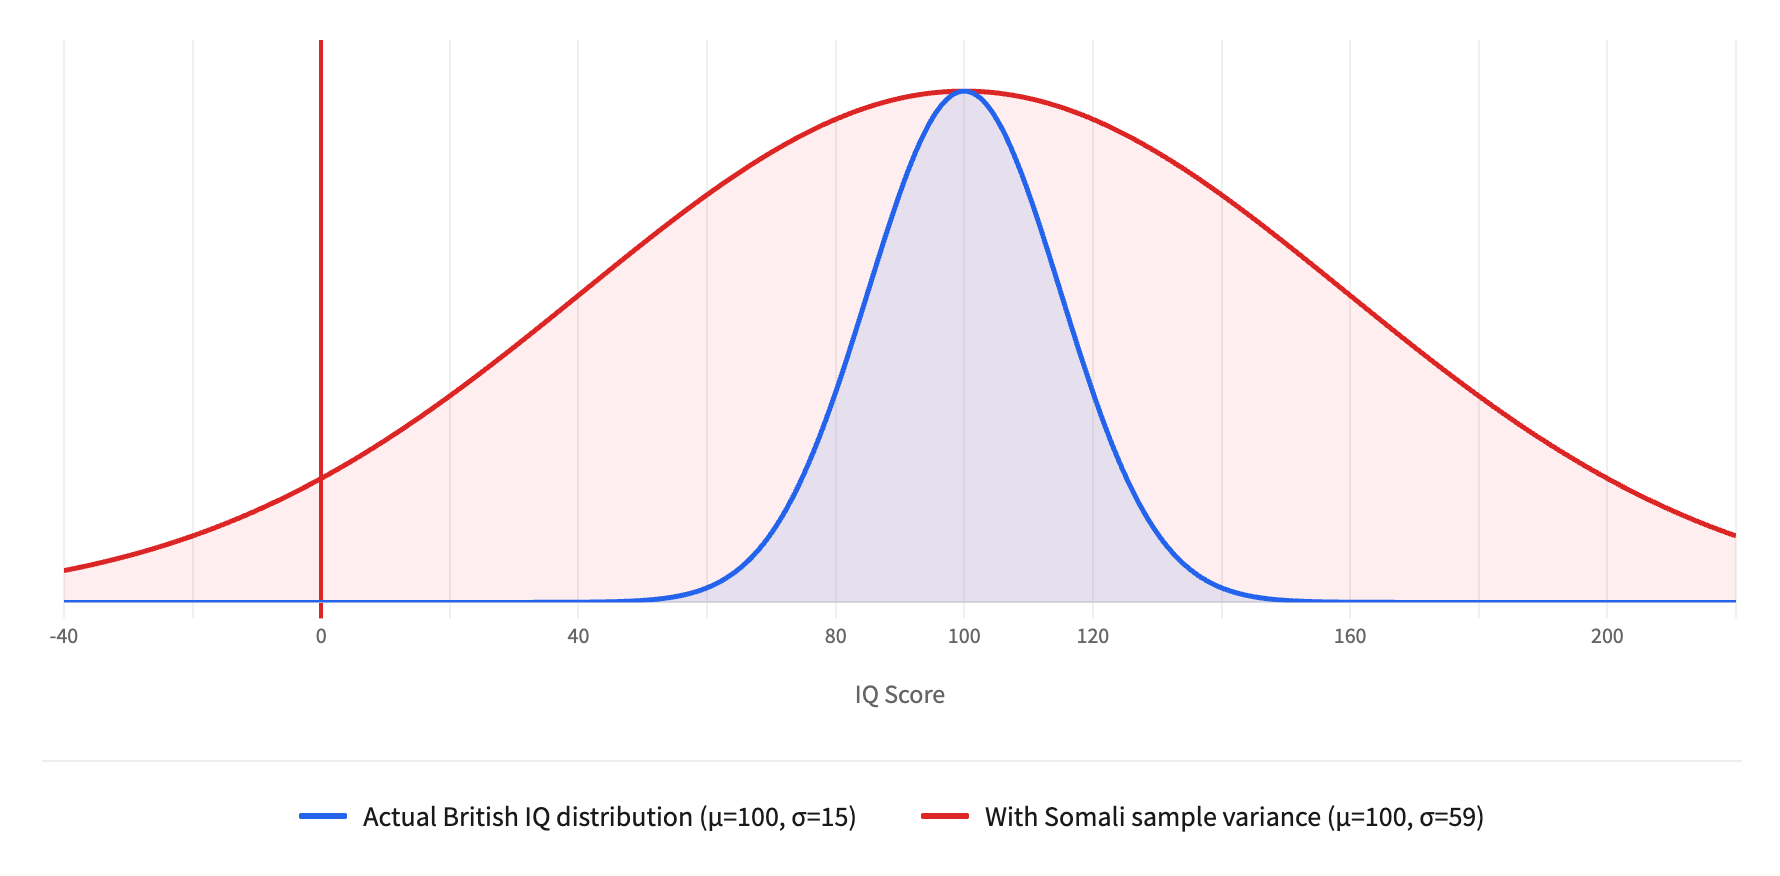
Now look at the standard deviations. For 18-year-old males, the mean raw score is 21.2 with a standard deviation of 12.6 – 59.4 percent of the mean. This is the coefficient of variation. It tells us how dispersed the data are relative to the average. For a properly normed IQ test administered to a representative population, the coefficient of variation is approximately 15 percent. This sample has nearly four times the expected variability. The sample is so heterogeneous that no single number can reasonably characterize it.
The authors didn’t publish them, but we can try to imagine what the distribution of individual scores must look like. For 18-year-old males, the mean minus two standard deviations is 21.2 – 25.2 = -4.0. You can’t score below zero on the test so it is mathematically impossible for the distribution to be normal. There is likely some severe floor effect, with scores piling up near zero. Some portion of these young men are essentially guessing randomly on a test designed for a context utterly alien to their lives.
To grasp how anomalous this variance is, imagine applying it to a British sample. The standard British IQ distribution is normed to have a mean of 100 and a standard deviation of 15. If British test-takers exhibited the same coefficient of variation as the Somali refugee sample (59.4 percent), the standard deviation would be 59 points instead of 15. Under such a distribution, 95 percent of Britons would have IQs ranging from -18 to 218, 31 percent would be classified as intellectually disabled, and 31 percent would be classified as profoundly gifted. This is, obviously, nonsense. No competent psychometrician would accept such a distribution as measuring anything coherent.
It is hard for me to imagine the level of intelligence required to look at a sample of people living in a refugee camp fleeing a civil war and believe their results on a geometric pattern test, with a coefficient of variation of 59.4 percent, represent the genetic potential of an entire ethnic group. But this is not an isolated example.
Lynn’s estimate for Ethiopia is derived from a 1989 study of 134 children living in an orphanage in Jimma. Orphans in developing countries are among the most nutritionally and emotionally deprived populations imaginable. The estimate for Equatorial Guinea (the lowest in the database) is derived from a study of Spanish children in a home for the developmentally disabled. These were not even Equatorial Guinean citizens. The estimate for Botswana comes from 140 adolescents sampled in South Africa who were used because they belonged to an ethnic group also found in Botswana – not because there was any evidence they were from Botswana. For Nigeria, Lynn selected the lowest scores from a study of just seven Nigerian and Leonese children, while ignoring multiple studies showing Nigerian IQs far above his estimate of 69. For South Africa, one data point came from a study of just 17 illiterate Black South African children. The national IQ for Angola, a country of 35 million people, was calculated from 19 individuals, about whom almost nothing is known except that they did not have malaria. Half of the national IQ estimates for sub-Saharan and Latin American countries in Lynn’s dataset are based on fewer than 1000 individuals. Many are based on fewer than 100.
The studies Lynn compiled used at least 12 different test types, each with multiple subscales. Some were IQ tests; some were educational assessments that measure learning rather than intelligence; some were specific cognitive tasks never intended to estimate general cognitive ability. Of the 98 samples included for calculation of sub-Saharan nations’ average IQs, 89 percent used only a type of Raven’s Progressive Matrices to estimate IQ. Raven’s Progressive Matrices is a non-verbal test used to measure general human intelligence and abstract reason. The questions consist of eight geometric patterns, and the test subject is asked to identify the missing ninth pattern. A 2015 study found that Raven’s Progressive Matrices is not a reliable measure of general intelligence, sharing only 50 percent of its variance with g, 10 percent with fluid intelligence, and 25 percent of variance test-specific. Yet it is often used in cross-cultural comparisons under the assumption that the test instrument is not confounded by cultural or national differences.
How warranted is this cross-cultural use? James Flynn has shown that British children’s average scores on Raven’s Progressive Matrices rose by 14 points from 1942 to 2008. A composite of IQ gains in Britain, Belgium, Norway, the Netherlands, Israel, Argentina, and an estimate for the United States estimated an increase in 27 points for Raven’s Progressive Matrices from 1947-1948 to 2002. While the “Flynn Effect” refers to the increase in general IQ gains over time, this is the IQ subtest most affected by it. There are several hypotheses about the cause of this increase, including increased schooling and test familiarity, better nutrition, increased cognitive stimulation in the environment, eradication of infectious diseases, and heterosis – the reduction in levels of inbreeding.
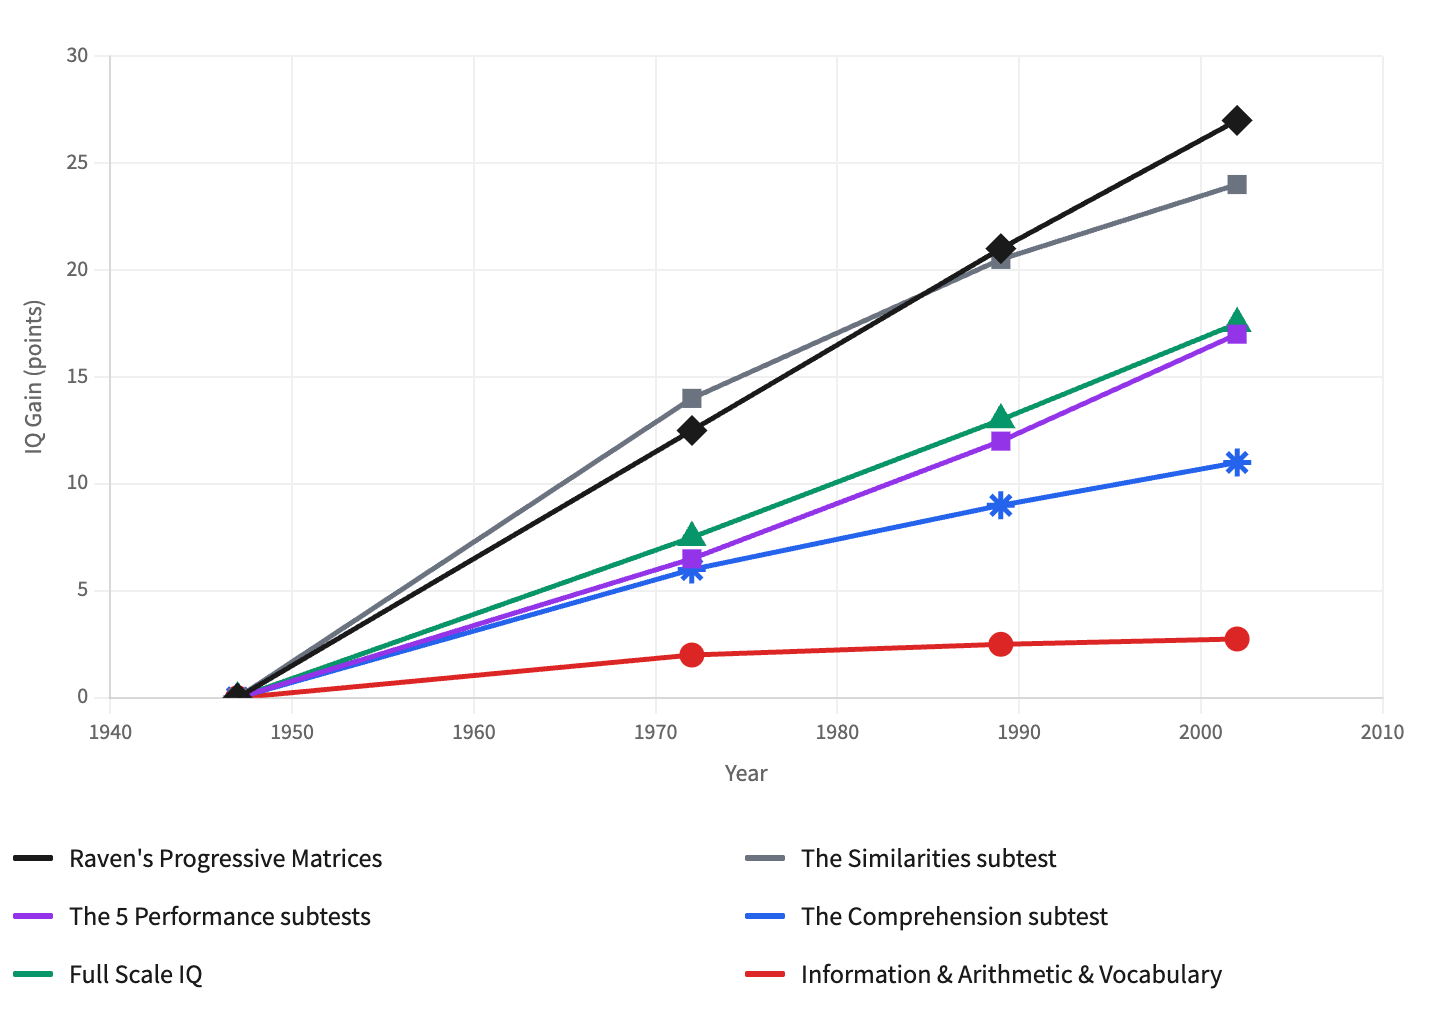
There is some evidence for all of these factors, with the caveat that heterosis cannot possibly be a large factor – even if everyone mated with their siblings in 1900, the subsequent increases in heterosis would not explain the entirety of observed IQ gains. If these factors – environmental factors that differ between populations – are the cause of this increase in IQ, especially Raven’s Progressive Matrices, then there is clear measurement bias, because it follows that the measurement is not only measuring intelligence, but also the subject’s environment and their access to resources.
Many of the studies Lynn included were specifically designed to measure how cognitive ability is affected by adverse conditions: malnutrition, lead exposure, malaria, parasitic infection. These studies compared affected and unaffected children precisely because the researchers expected – and found – cognitive deficits in the affected groups. Lynn then used the affected groups’ scores as national IQ estimates.
Lynn’s citers treat intelligence as an obvious biometric, a number as transparent to the outside world as your height or weight. They use “low IQ” as a synonym for unintelligent, “140+ IQ” as a synonym for genius, and apply these descriptors to people who have never taken an IQ test, let alone broadcast the results on their forehead. This framing serves a purpose. If intelligence is a biometric as legible as height – fixed, heritable, and measurable – then observed inequalities become natural facts rather than the products of political (or individual) choices. An intelligent engineer contributes much to society, but not because he was raised in a home with hundreds of books, nutritious food, and a private school education. Nor is it that he had a dream and worked hard. He contributes much to society mostly because he has great genes. Gran sangre. Great blood. The vocabulary has changed. The logic has not.
In July 2020, the European Human Behavior and Evolution Association issued a formal statement explicitly opposing the use of Lynn’s national IQ dataset:
“Any conclusions drawn from analyses which use these data are therefore unsound, and no reliable evolutionary work should be using these data… These datasets fall a long way short of the expected scientific standard of rigour, in terms of both data curation and measure validity.”
Lynn’s emeritus status at Ulster University was revoked in 2018. He died in 2023. But his dataset persists. It appears on health information websites, data almanacs, and the websites of children’s therapy companies. It has been cited over 23,700 times on Google Scholar, with more than 3,500 of those citations since 2021. The journal Intelligence, published by Elsevier, published at least 43 articles by Lynn, and he sat on its editorial board until 2018.
In 2024, a group of seven scientists published a detailed analysis in STAT News calling for the retraction of Lynn’s papers and all work that uncritically cites them. They document how the dataset has become embedded in white supremacist discourse – cited hundreds of times on neo-Nazi websites and invoked in the manifestos of mass shooters in Buffalo and Norway. They wrote this:
“Lynn’s work has been repeatedly condemned by social scientists and biologists for using flawed methodology and deceptively collated data to support racism…scientific rigor or curiosity were never important to Lynn; his academic work was merely a vehicle to promote ideological goals.”
I have dwelt on Lynn’s dataset at length because its dishonesty was required for the slow advance towards the current political moment. When politicians and tech leaders tweet about national IQ differences, when podcasters and bloggers cite “the data” on race and intelligence, when reply guys reassert, over and over again, that immigration from “low-IQ” countries will damage Western civilization – they are drawing from this poisoned well.
The pipeline has its intermediaries. In January 2025 – five years after the European Human Behaviour and Evolution Association formally condemned Lynn's dataset, three years after Rebecca Sear demonstrated it was unfit for scientific purpose, seven months after STAT News called for mass retractions – Scott Alexander, the influential blogger who has shaped Silicon Valley and the rationalist community, published "How To Stop Worrying And Learn To Love Lynn's National IQ Estimates". The title tells you everything. Scientific skepticism is reframed as emotional discomfort to be overcome. Alexander's central move is to argue that accepting Lynn's data is actually the anti-racist position: if IQ is environmental, then worse environments should produce lower scores, so Lynn's numbers prove environmentalism works. This is sophistry. The scientific critique was never "these numbers are too offensive to be true." It was "the methodology is so unsound that we cannot know what is true." You cannot use garbage data to support any conclusion. But Alexander doesn't engage with Wicherts, or Sear, or the EHBEA statement. His sources are Aporia Magazine and Emil Kirkegaard – the same human biodiversity network, citing itself. The article’s function is not to evaluate evidence; it is to give permission. It tells educated, reasonable people that they can repeat these numbers without being the kind of person who repeats these numbers. It is the moment when data rejected by mainstream science gets transmuted into something a tech CEO might casually cite, or a policy analyst might assume is credible because a smart person defended it.
The data is not good. The methodology is not sound. The conclusions are not supported. And the man who created it was explicit about his goals: “I am very pessimistic about the future of the West,” Lynn wrote. He advocated for “phasing out” non-white societies. He believed in “racial cleansing”. He was, by his own admission, engaged in “the rehabilitation of eugenics”. This is not the case of a dispassionate scientist following the evidence wherever it leads. When someone cites “national IQ” data to you, they are citing Richard Lynn. And Richard Lynn was not doing science; he was doing politics.
Every ideology of human hierarchy has presented itself as an observation, not invention. The architects of rassenhygiene and entnordung were not hatemongers – they were scientists, following the data where it led. The trick works because it recruits people who would never consider themselves participants in anything monstrous. You are not repeating a lie designed to dehumanize; you are citing a study. You are not laying the groundwork for exclusion, displacement, or worse; you are simply noting an uncomfortable fact that others are too cowardly to mention. This is how ordinary people become complicit in extraordinary harm. I visited Auschwitz-Birkenau last July. It is easy to weep when you are standing over the remains of a gas chamber, when the path from here to there feels infinite. It is not infinite. Genocides do not begin with bullets. They begin with numbers invented to make the bullets seem rational.
In 2022, Emil Kirkegaard founded the Human Diversity Foundation (HDF), registered as an LLC in Wyoming. HDF now publishes both Mankind Quarterly and Aporia Magazine. In April 2025, the organization was renamed Polygenic Scores LLC.
This article means a lot to me. I’m a Haitian-American data science student who has been obsessed with this topic ever since people started using it this way. This is so incredibly helpful. I hope this knowledge spreads.
And here's my 2022 article on the World Bank's Harmonized Learning Outcomes database:
https://www.takimag.com/article/a-little-learning/
At least since the 2002 book "IQ and the Wealth of Nations" by Richard Lynn and Tatu Vanhanen, social scientists have been publishing rankings of countries by average cognitive test scores and pointing out how closely these figures correlate with gross domestic product per capita.
The mere existence of this data causes outrage among the growing numbers of science denialists, who are increasingly calling for banning all scientific research touching upon differences in cognitive capabilities among populations.
On the other hand, investors want to know these numbers because they are closely linked to national prosperity. So, I’ll present below my three-part graph of the World Bank’s “Harmonized Learning Outcomes” for 174 countries.
Two main types of cognitive exams contribute to the various lists: IQ and school achievement.
Intelligence testing has been one of psychology’s biggest success stories for the past 117 years but is much denounced by the ignorant. In contrast, school achievement exams, such as the OECD’s PISA test, are (or were) highly respectable. They even were briefly fashionable during the school reform craze of a decade ago.
National average IQ estimates typically come from intelligence test publishers who need to validate a new edition of their test in each country in which it will be sold. This requires testing it on a sample of usually a few hundred people to make sure nothing weird is going on with the new questions.
International school learning tests have been massive projects since the first TIMSS/PIRLS tests in 1995 and PISA test in 1997. They generally aim for sample sizes in the thousands in each country.
Theoretically, these two approaches could produce wildly different results: e.g., we might speculate that the Scottish Highlands and inland Finland in, say, 1500 were full of clever, high-IQ but poorly educated barbarians and backwoodsmen. But we just don’t know. (We might eventually be able to grave-rob enough skeletons from old churchyards, recover their DNA, and measure their innate educability from their genomes. But even that wouldn’t tell us about their cognitive performance in 1500.)
What we do know is that in this century, both methodologies—IQ tests and school tests—tend to generate similar results. National average IQ and school test scores are closely correlated.
This could be because IQ drives school performance—an unpopular but reasonable view.
Alternatively, strong schools could make children smarter. For example, in the U.S., federal NAEP scores dropped sharply when schools switched to remote learning during the pandemic.
Both causal pathways sound plausible to me.
Or, either factor, or both, could interact with their third close correlate of national wealth. But what causes what?
For example, over the last two-thirds of a century, South Koreans have increased spectacularly in GDP per capita, average test scores, and height. Good things seem to go together, but which causes which is less obvious.
On the other hand, countries rising or falling dramatically in the rankings take decades to manifest and don’t happen all that often. Thus, interest in the triennial PISA faded over the last decade because nothing much changed in its results. PISA results would be exciting if new prime ministers could suddenly drive up test scores, but they can’t. In the real world, it’s hard to wring clickbait headlines out of Estonia finally overtaking Finland for the top spot among white countries.
One issue has been that most of the recurrent participants in the two big international school tests, PISA and TIMSS, have been more or less first-world countries. European countries tend to score within a fairly narrow band not too much wider than the margin for error. (Inevitably, there’s a lot of noise in the data: Just think about how much work is involved in giving tests in different languages.)
So, yeah, sure, test scores show that Finns on average are probably a little smarter than Serbs (but technology hero Nikola Tesla was pure Serb, so don’t get carried away by averages). Yet for most of Western Europe, whether one country outscores another tends to depend more upon the quantity and quality of its immigrants than upon slight differences between the natives.
Still, global patterns in test scores are visible: Typically, countries primarily populated by northeast Asians, such as the vastly prosperous city-state of Singapore, rank near the top, followed by European-dominated countries. (Interestingly, the obscure northeast European countries of Finland and Estonia do better on school test scores than the more famous northwest European ones.) Latin American, Middle Eastern, and South Asian countries tend to follow (with Muslim countries generally doing somewhat worse than their non-Muslim neighbors), with sub-Saharan states at the rear.
But poor countries seldom gear up for the big PISA or TIMSS tests because they are both expensive and discouraging: "Thanks for proving our schoolkids aren’t as smart as the Japanese or Poles. And tell us something we didn’t already know."
Fortunately, regional tests have emerged to allow African (SACMEQ for 16 states in southern and eastern Africa and PASEC for 10 west African nations) and Latin American (LLECE) countries to compete against their neighbors on an equal footing.
And there is now the Early Grade Reading Assessment (EGRA) of basic literacy that has been administered in 65 countries.
As explained in their 2021 paper in the top science journal, Nature, “Measuring human capital using global learning data,” researchers affiliated with the World Bank have now compiled a database of what they call “harmonized learning outcomes” (HLOs: i.e., test scores) with over 2,000 data points.
By “harmonized” they mean they’ve linked scores on the famous global exams to the smaller regional ones. For example, Colombia, El Salvador, Chile, and Honduras have all taken both the worldwide TIMSS and the local LLECE in the same year, allowing the World Bank boffins to estimate how other Latin countries would have done on the TIMSS from their LLECE scores. They can then link TIMSS to PISA scores and, ultimately, put 174 countries on a single scale with 500 as the Western midpoint and 100 as the standard deviation.
It’s the same ambitious methodology applied internationally as Sean Reardon did with Stanford’s American school test database in which he takes test scores from every school district in the U.S. from the 50 different states and then uses the federal NAEP scores for each state to put all the different state tests on the same gauge.
Okay, who won? According to the World Bank, who averaged the highest scores on the various tests from 2000 through 2017?
As you’d expect, the crazy rich Singaporeans averaged 575, followed by Macau and Hong Kong. Estonia did the best among Europeans at 543, slightly ahead of Japan at 538, South Korea 537, Canada and Finland 534, Poland 530, and Ireland 521. The U.S. scored a respectable 512. (As I’ve pointed out before, our kids do pretty well relative to their demographics.)